Market and key figures at a glance
Price development
As an introduction to the topic, an overview of the resource gold itself is interesting. Looking at the precious metal, it should be noted that it was one of the best performing assets last year and also had one of the lowest drawdowns over the course of the year. This good performance was based on high volatility or risk aversion in the equity market, low interest rates and positive price momentum. In early August 2020, the gold price then marked an all-time high of USD 2,067. As the U.S. yield curve turned at the long end, the price of the precious metal began to decline. In the second half of 2021, demand for physical assets (ETCs, bars, coins) picked up as strategic assets.
Demand in the market
Meanwhile, gold demand is fed by the jewelry, investment vehicle, and industrial categories. In 2020, global gold demand was still about 3,759.6 tons, a decline in demand of about 14% from the previous year. The jewelry sector traditionally accounts for the largest share of total global demand. In 2020, however, demand here fell to 1,412 tons. Conversely, demand for Gold as a crisis currency was stronger. The investment sector accounted for 1,773 tons of gold. 302 tons of gold were demanded by industry and 273 tons of gold by central banks.
Supply of gold
A total of 3,400 tons of gold were produced last year. China as the largest producer recorded an output of 380 tons, followed by Australia (320 tons), Russia (300 tons), USA (190 tons) and Canada (170 tons). The TOP 5 thus represented about 40% of global production, while the TOP 10 represent two-thirds of output. In addition to the produced quantity, which is lower than the above mentioned gold demand, the supply is expanded by the reprocessing of scrap gold (2020: 1,297 tons) and partly also by hedging of the producers (2020: -65 tons). Thus, a total of 4,633 tons of gold entered the world market. 1
M&A is the trend
Several key trends have been shaping the industry for years. Globally, project gold grades are declining. In addition, there is an increasing shortage of high-quality development projects. In addition, reserves, i.e., gold deposits that have not yet been mined, are declining.
Major producers such as Barrick are increasingly focusing on acquisitions in addition to the further development of their own projects and exploration activities. Experts expect a significant increase in M&A activity in this sector, as in the course of the current high gold prices and corporate profits as well as strongly increasing cash flow generation, in addition to debt reduction, substantial funds are available for acquisitions. In addition, the industry is highly fragmented, as a look at a McKinsey study reveals. 2 .
"The fact is that the industry has not replaced what it has previously mined. Barrick, on the other hand, is running its business for the long term, rather than focusing on short-term profits, and is working to extend its resource-based 10-year plans to 15 or even 20 years," President and CEO Mark Bristow said of the industry's challenges as part of Q2 numbers as recently as August.
Second largest gold producer
Barrick Gold Corporation, headquartered in Toronto, Canada is the second largest gold producer in the world. Its business activities include the production and sale of gold and copper, as well as exploration activities and mine developments. Approximately 90% of sales are in the precious metal and 8% in the industrial metal copper. The Company holds interests in 14 gold mines, including six tier-one gold assets, i.e. mines producing at least 500,000 ounces of gold p.a. over a ten-year period or more.
High quality and longevity
The Company's gold mines are geographically well diversified and are located in Argentina, Canada, Côte d'Ivoire, the Democratic Republic of Congo, the Dominican Republic, Mali, Tanzania and the United States. The Company's copper mines are located in Zambia, Chile and Saudi Arabia. Geographically, the most significant location is the United States. Overall, the assets are of high quality and long operating life. 3
Tier One Gold Mines with a Focus on the U.S.
Barrick's geographic production focus is the USA. Acquisitively, however, 2019 was significant for Barrick in other locations. First, the Canadians acquired Africa-focused gold producer Randgold Resources. However, the attempt to take over the world's largest producer Newmont failed. Nevertheless, an advantageous situation arose for both companies, as together they founded the Joint Venture Nevada Gold Mines (NGM), to which both contributed significant assets in the US state. According to company sources, the goal is to create the largest gold-producing complex in the world. Barrick holds 61.5% of NGM, with Newmont owning the remaining shares.
Among the Canadians' six tier-one gold assets, the Carlin complex has by far the largest output (2020: 1.665 million ounces of gold). The Carlin Trend is the most significant ore-affecting fault in the U.S. state of Nevada and is expected to remain a major exploration focus for Barrick for many years to come. The Cortez Complex consists of the Pipeline open pit complex and the Cortez Hills underground operation. Production activity in the Cortez area dates back over 150 years. Prospective exploration and development projects include Goldrush, Robertson and possibly Fourmile, according to the company. Gold production here was 799,000 ounces of gold in 2020.
Several open pit and underground mines make up the Turquoise Ridge complex. The high-grade Turquoise Ridge underground mine is the value driver of the complex, with construction of a third shaft progressing (2020 production: 537,000 ounces of gold). The Carlin, Cortez and Turquoise Ridge complexes are wholly owned by the joint venture company Nevada Gold Mines.
Produced the largest Barrick mine 2020
At Kibali (Democratic Republic of Congo), the company records one of the largest gold mines in Africa, consisting of open pit and underground operations. Successful reserve growth in 2020 has extended the life of the open pit to over 10 years (2020 production: 808,000 ounces of gold).
The Pueblo Viejo Project in the Dominican Republic consists of two open pit mines (Moore and Monte Negro). The planned expansion of Pueblo Viejo will significantly extend its life to 2040 and beyond (2020 production: 903,000 ounces of gold). Finally, it remains to mention The Loulo-Gounkoto Complex in Mali. It comprises the Yalea and Gara underground mines in Loulo and the Gounkoto open pit mine. Open pit mining operations have been underway at Loulu since 2005. Gounkoto has been operating as an underground mine since 2011, and the complex's third underground mine will start production this year (2020 production: 680,000 ounces of gold).4
Barrick delivers decent numbers
Recently, the Canadians published their Q3 figures. In the run-up, there were big question marks, as recently the number 1 in the industry Newmont massively disappointed with its quarterly data. Newmont's figures were significantly below expectations, and the industry leader also lowered its outlook for the current fiscal year. However, Barrick was able to deliver. Barrick's gold production in the third quarter was 1.09 million ounces. Revenue fell significantly year-on-year to $2.531 billion, as the realized gold price in Q3 was lower at $1.771 (previous year: $1.926). Adjusted earnings per share were $0.24 in Q3, beating market expectations by $0.01. A dividend of $0.09 was declared for the quarter, as well as another extra dividend of $0.14, which will be paid on December 15. Given the strong operating environment, further special dividends appear realistic in the coming quarters. The balance sheet remained strong with cash of around USD 5.15 billion. This was offset by debt of USD 5.04 billion.
The quarterly data confirmed the continuation of strong operating performance from 2019 and 2020.

SWOT - Short & sweet on value
Strengths
- Second largest gold producer in the world
- High earnings in 2020 and 2021
- Strong debt/building net cash position
- Strong exploration culture combined with a strategy of sustainable profitability
- Advantageous copper exposure
- Low debt
Weaknesses
- Hardly any production growth possible
- Decrease in resources
- Difficulty in acquiring new projects at good conditions
- Weak share price development
Opportunities
- High cash flow generation and thus funds for acquisitions
- Life extension of existing mines
- Rising prices for gold and copper
- Margin increase due to very high profitability of copper business
- Dividend increases
- Share buybacks
- Share price catching up with the industry
Risks
- Falling gold price
- Weak global economy
- Strongly rising interest rates with moderate inflation
- Jurisdiction risks
- Weakening of supply chains due to pandemic
- Rising energy costs
What's coming and expected
Barrick is targeting gold production between 4.4 to 4.7 million ounces of gold for the current fiscal year. With the Q3 figures, the Canadians specified the guidance and now expect to reach the upper end of the target range. This is based on the assumption of stable production from the six tier-one gold mines.
What analysts say
Analysts on average forecast a slight increase in sales and earnings for 2021 and 2022. Accordingly, revenue is expected to increase from USD 12.0 billion to USD 12.2 billion. On average, the experts expect net income of USD 1.9 billion in the current fiscal year, which is expected to climb to USD 2.1 billion in the following year.
On average, analysts expect this net result for 2021
This would result in a 2021 P/E ratio of 18 and a 2022 P/E ratio of 16. The most significant change, according to analysts, will take place with regard to net liquidity: By the end of 2021, this is expected to increase to almost USD 100 million. For 2022, a strong increase in net liquidity of USD 1.8 billion to USD 1.9 billion is forecast.
The majority of experts are bullish on the stock and on average formulate a price target of CAD 35. This holds out the prospect of upside potential of over 40%. 5
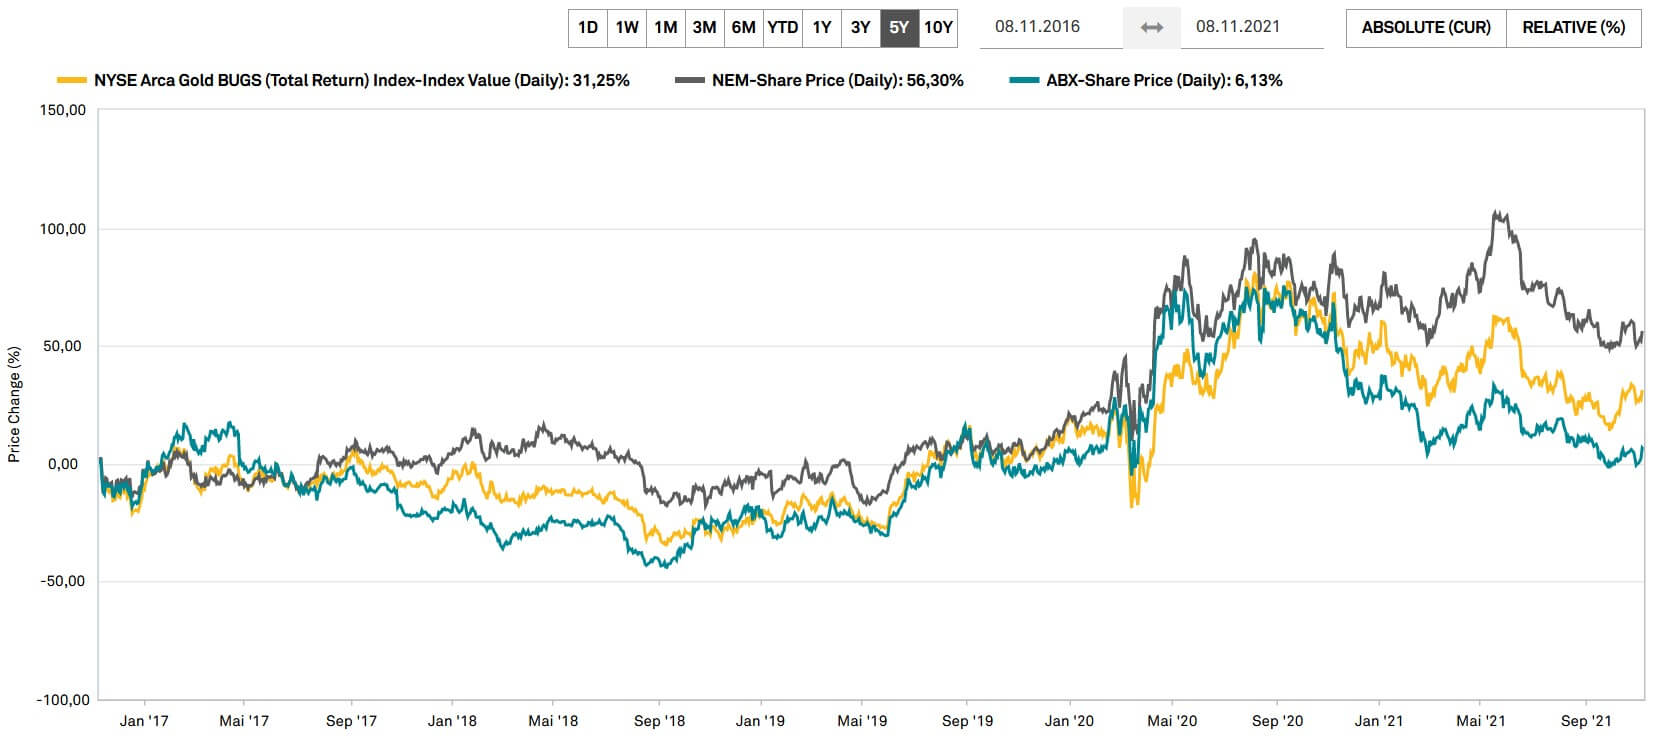
Pent-up demand is discernible
The NYSE Arca Gold BUGS Index tracks the price performance of the world's 26 largest gold producers. The index lost about 20% in value over the past 12 months. Barrick and Newmont have nearly identical weights at just over 15% each. Barrick shares lost 30% during this period, while Newmont lost only 15%. Gold is currently trading around 7% weaker than last year. This illustrates the high leverage of the NYSE Arca Gold BUGS Index and the Barrick share in relation to the gold price development. In addition, the Barrick share is lagging behind the papers of the largest gold producer Newmont.
Outlook and ratios attractive
Barrick benefits from higher gold prices and production volumes. Looking at the big picture, several aspects support a medium-term rise in gold prices. It is a combination of a low interest rate environment, rising inflation and crisis currency in volatile stock market times. In addition, the global economic recovery is increasing demand for gold.
One possible explanation of declining gold prices since the all-time high in the summer of 2020 is a rise in U.S. yields and the pricing in of higher interest rates in the medium term. This adjustment process can only be classified as a short-term headwind. This is because, as the past has shown, the gold price can perform strongly even with rising nominal yields if inflation rates rise faster than interest rates. This scenario is considered very realistic among experts.
In the wake of high profitability in the last and current fiscal year, cash flow generation has increased significantly. Analysts forecast high net cash balances in the coming fiscal years.
amounts to the expected didivende according to financial experts
In addition, a shareholder-friendly dividend policy is taking effect, under which a supplementary dividend was distributed most recently. The continuation of the special distributions is quite realistic, which means that the dividend yield should be around 4%. As the guidance shows, production should increase noticeably in the second half of the year. The multi-year outlook of the Canadians is at values around 4.7 million ounces of gold p.a 6 . Thus, the price level of gold will again be more decisive for the group.
The bottom line is that the current price level of Barrick shares is an attractive entry opportunity for long-term investors for a number of reasons. First and foremost is the plausible assumption of a rising gold price. The high copper price will also have a margin-increasing effect thanks to the megatrend of electromobility. High earnings and free cash flow can contribute to share appreciation in several ways: a rising net cash position, higher dividends, potential share buybacks and sufficient financial resources for acquisitions. The bottom line is that the stock has pent-up demand relative to the industry, and this is reflected in analysts' average price target of $35 CAD (Canadian dollars). 7